A platform where you discover how people think, believe and act — with real studies, solid data and tools you use for your own projects.

Whether you start from curiosity or from a project topic, there's a way in.
you are curious to better understand what happens around you and to discover how people think, what they believe and how they act;
you want to discover best practices in running a market study — from building the questionnaire to processing, analysing and interpreting the data;
you need real data for marketing projects, market research, bachelor theses or other academic work;
you want to practise analysis methods on consistent databases and test different hypotheses;
you wish to run your own market study, collect responses and get the database, processing and charts all in one place;
you are looking for inspiration in choosing a project topic or formulating research questions;
you want to move from theory to practice and work with tools and data similar to those used in the market research industry.
All content is based on real studies, carried out in line with market research industry standards. Beyond the obvious results, you can connect pieces of information, formulate hypotheses and discover new, sometimes surprising perspectives.
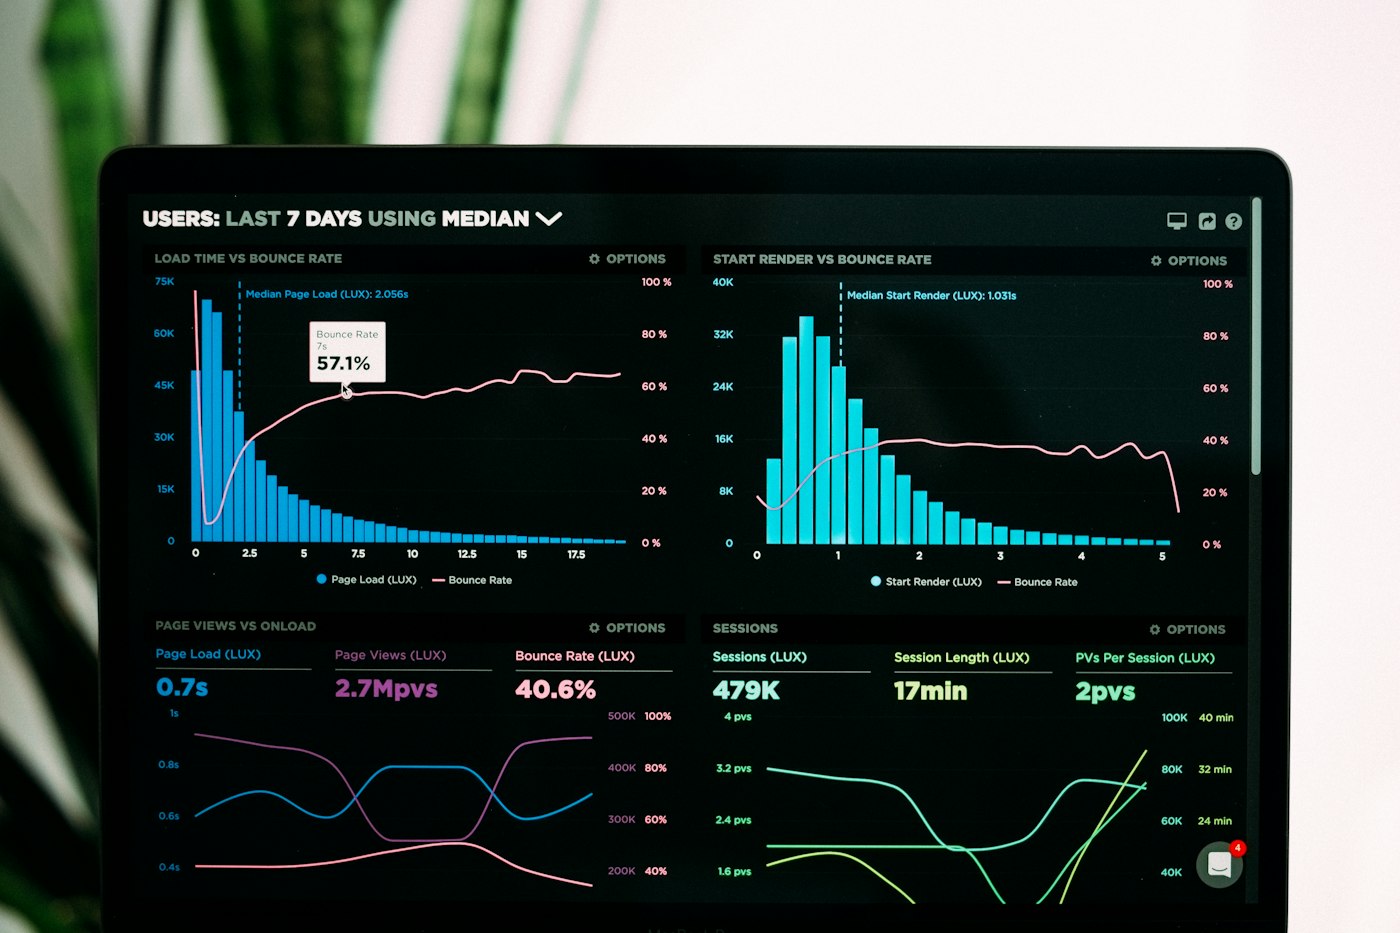
Some studies address complementary topics, others are repeated periodically to track how opinions and behaviours evolve over time. You gain access to a complex universe of attitudes, perceptions, beliefs and habits.
Usually over 1,000 respondents, representative of the urban population aged 18–65. The sample size allows both the analysis of overall results and in-depth exploration of subgroups or segments.
They respect industry standards and best practices. You can see how questions are phrased and ordered, how a questionnaire's logic is built, which scales are used and how to measure topics with a high degree of social desirability.
Cross-tabulations (“crosstabs”) in Excel, with statistical significance tests so you can spot the relevant differences between groups. You can download the standard charts and drop them into presentations or papers.
You get access to the studies' databases for additional analysis:
You create and run your own research project. After configuring the questionnaire, you generate a link or a QR code for participants. At the end you download the database, the cross-tabulations and the standard charts.
A few simple steps, depending on what you need: downloading data or running your own study.
Log in to the platform (Login, top right).
Choose the study or topic you are interested in.
Enter the study (click the green icon on the left).
Explore the questionnaire and, indirectly, the available results (Questionnaire Design, on the left).
Generate tables (Export Analysis), charts (Charts) and/or download the database — closed or open questions (Export Database, respectively Export Open Questions).
Analyse the results.
Log in to the platform (Login, top right).
Create a new project (Add New Project from the menu).
Fill in Project Details, Sample Size & Structure and enter the questionnaire in Questionnaire Design.
Set the project as active.
Copy the link or the QR code from the bottom left and use them to collect data.
Responsible research rests on clear rules and respect for respondents.

The data may be used for educational and academic purposes, subject to the terms of use. When you include results, tables or charts, mention the study, the sample/base size, the data source and the period in which it was collected.
The databases contain no information that allows the direct identification of respondents. The data must be used responsibly, without attempting to identify participants. For your own studies, inform participants about the purpose, how responses are used and the voluntary nature of participation. Keeping responses confidential is the cornerstone of market research.
Every study has limits — driven by the collection method, sample structure, question wording, the fielding period or respondent behaviour. A good analysis does not present only the conclusions, but also notes the limits to keep in mind when interpreting them.